The Boston Consulting Group was the creator of the BCG matrix or portfolio analysis. It provides a framework for the examination of products based on market share and growth. Since 1968, businesses have used The Matrix to have a better understanding of which items will enable them to capitalize on possibilities for market share expansion.
The BCG Matrix presentation slide aid in the creation of goals and strategies. Additionally, to shift goods across the quadrants based on their performance.
What is the BCG or Growth-Share matrix?
The four-celled BCG Matrix was created by the Boston Consulting Group (BCG) to assist in long-term strategic planning. On the basis of market growth rates and relative market share throughout industries and sectors, the matrix is used to evaluate the potential opportunities of various goods and brands that a business has in its portfolio.
By examining market growth and relative market share, the growth-share matrix is used to conduct a two-dimensional examination of a company’s product/brand portfolio. The matrix enables the company to determine where to invest, divest, or develop new goods by allowing it to assess the business potential and market context of various products and brands.
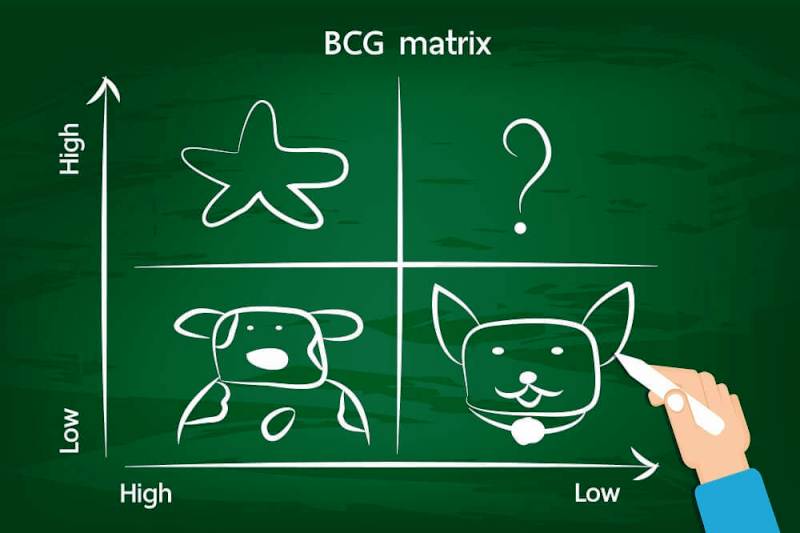
The concept is based on the finding that business units inside an organization can be divided into four groups:
- Cash Cows
- Stars
- Question Marks
- Dogs
Understanding the 4 quadrants of a BCG Matrix

Source: consultport.com
There are four quadrants in the Matrix. Based on market volume and relative market share, each quadrant signifies a position relative to the others.
The BCG is more applicable to bigger businesses with a variety of services and markets. Smaller companies with a wide variety of products can utilize this to analyze their products, nevertheless.
The 80:20 rule is frequently in use. To put it another way, the BCG matrix offers a way to analyze your business and decisions because 20% of the items generate 80% of the revenues.
-
Stars (high growth, high market share)
Stars flourish quickly and control a large portion of the market. The top left quadrant of the matrix contains stars. Stars are well-known items or brands in marketplaces that are seeing rapid growth; therefore, businesses should invest more in them. They contribute a large portion of the market share and earn a sizable revenue. Compared to those living in the other three quadrants, stars often produce higher ROI.
-
Cash cows (low growth, high market share)
The lifetime of products in this quadrant has successfully finished the start-up stage, and they are now in the saturation stage. It is not necessary to reinvest profits in order to consolidate, boost market share, or accelerate expansion. The emphasis is on assimilation. They give the company the ability to transform unknowns into market leaders, pay for administrative expenses, fund R&D, pay off debt, and distribute profits to shareholders. Investment in cash cows is advocated for businesses to keep up current levels of production.
-
Dogs (low growth, low market share)
Dogs have a small market share and a slow rate of market expansion. They neither produce money nor demand a lot of it. They are typically not worth spending on because they have little or negative cash returns and could be expensive to maintain. These items have cost disadvantages as a result of their small market share.
-
Question marks (high growth, low market share)
Question Marks also referred to as “Problem Child,” are items with low market shares in an industry with strong growth. It’s not apparent which way these products will swing, which is why they are known as question marks. Will they ascend into the region of the stars or descend to the quarter of the dogs?
Pros & cons of BCG matrix
Source: studiousguy.com
Pros
The following are the pros of a growth-share matrix.
- Simple to carry out;
- Aids in comprehending a business portfolio’s strategic positions;
- It’s a good place to start before doing more research.
Cons
The following are the cons of a BCG matrix.
- The word “market” is not defined. Businesses can be categorized as “cash cows” when, in reality, they are “dogs” or the opposite.
- Leaves out additional external factors that could drastically alter the scenario.
- The growth of the industry and market share are not the primary drivers of profitability. Furthermore, a large market share does not always translate into large earnings.

Source: business-to-you.com
Final Words
In conclusion, businesses can examine their functional areas or product lines using the BCG Growth-Share Matrix to help them decide how to deploy resources strategically. By charting units according to their market shares and growth rate, the matrix enables enterprises to determine whether their business units are in a strong or poor market position. This framework has become a commonly used tool for portfolio evaluation and strategic planning in businesses and business schools.


